
case study -- Retail and ecommerce analytics
CLTV Management App for D2C business
A D2C brand replaced a slow, unreliable analytics stack with a customer lifetime value platform built to keep pace with Shopify data.
- industry
- Retail and ecommerce analytics
- region
- India
- timeline
- December 2023 - ongoing
project snapshot
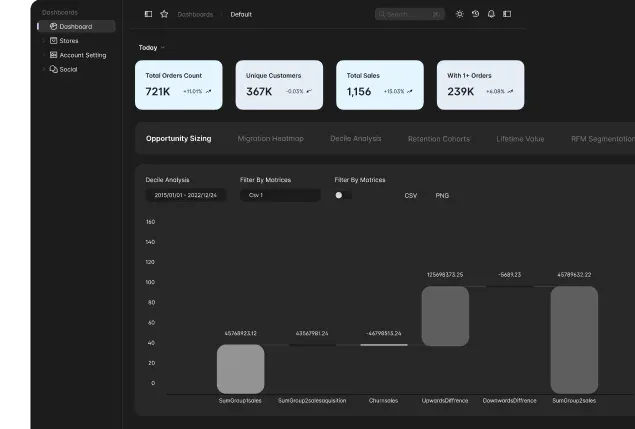
Syndell rebuilt a D2C brand's customer lifetime value platform on Node.js and D3.js, fixing Shopify data sync and caching issues, then adding cohort, RFM, and opportunity-size analytics. Live since December 2023, replacing an analytics stack the team could no longer trust.


overview
A direct-to-consumer business in India
A direct-to-consumer business built a customer lifetime value platform to understand which customers mattered most, but the platform itself had become a liability: slow data sync from Shopify, subpar charting, and caching problems that undermined trust in the numbers. Syndell was brought in to rebuild the analytics engine underneath the product. The engagement has run since December 2023, covering backend development, UI/UX design, and QA testing across the rebuilt analytics platform.
the challenge
What A direct-to-consumer business in India needed to solve
A CLTV platform is only as useful as the data behind it, and the original build had accumulated exactly the kind of technical debt that erodes confidence in a data product over time.
- 01
Initial data representation using Chart.js was subpar for the analysis the business needed
- 02
Issues fetching and integrating data from the Shopify API into the backend database
- 03
Slow performance and page speed concerns affecting the user experience
- 04
Caching system problems leading to inefficiencies in data retrieval
the solution
What did Syndell build for A direct-to-consumer business in India?
Syndell rebuilt the platform on Node.js, replacing Chart.js with D3.js for richer data visualization and fixing the Shopify integration and caching layer that had been holding performance back.
Replaced Chart.js with D3.js libraries for enhanced graphical data representation
Improved Shopify API data fetching and integration into the backend database
Comprehensive reporting added across purchase, sales, and stock analysis
Optimized Node.js queries to streamline data retrieval and improve page speed
Rectified caching system flaws for smoother, more reliable data access
A dedicated analytics dashboard built for complex, multi-angle data analysis
technology stack
- Node.js
- D3.js
- Shopify API
the outcome
What did this project achieve?
The rebuild delivered a set of purpose-built customer analytics tools rather than a single dashboard, giving the D2C business more precise ways to understand and act on customer value.
results below are self-reported by the client, as published in the original case study on syndelltech.com
Migration heatmap for visualizing customer segment movement over time
Decile analysis for segmenting customers by revenue contribution
Cohort analysis for tracking customer behavior across time periods
Opportunity size analysis for gauging untapped growth potential
Lifetime value calculation and RFM segmentation by recency, frequency, and monetary value
what this means for you
If your team has stopped trusting the numbers in your own analytics dashboard, more features won't fix that, better infrastructure will, the way fixing Shopify sync and caching did here first. Your cohort and RFM analysis are only as good as the data pipeline feeding them.
why it worked
D2C brands generate customer data faster than most teams can turn it into decisions, and a slow or unreliable analytics platform makes that gap worse, not better. Fixing the Shopify sync and caching layer first meant every downstream feature, the cohort analysis, the RFM segmentation, the opportunity sizing, was finally built on data the team could trust. Sequencing the work this way, infrastructure before features, is the difference between an analytics dashboard that looks impressive and one the business actually relies on for decisions.
This project drew on Syndell's web application development practice. Source case study reviewed on the live Syndell site at syndelltech.com.
more work
Related case studies
frequently asked
Questions about this project
01Why would a CLTV platform need a rebuild instead of new features?
This platform's Shopify data sync, charting, and caching had all degraded to the point of undermining trust in the numbers. Syndell fixed that infrastructure first, before adding any new analytics features.
02What customer analytics does a CLTV platform need?
This rebuild added migration heatmaps, decile analysis, cohort analysis, opportunity size analysis, and RFM segmentation, giving the D2C business several distinct ways to understand customer value.
03Can Shopify data sync issues be fixed without replacing Shopify?
Yes. Syndell improved the Shopify API data fetching and integration into the backend database, rather than replacing the ecommerce platform itself.
04What replaced Chart.js in this rebuild?
Syndell replaced Chart.js with D3.js libraries for richer, more accurate graphical data representation across the analytics dashboard.
next issue -- your project
Have a project like this in mind?
Tell us what you're building. We'll tell you honestly what it takes to ship it well.
proof -- Migration heatmap for visualizing customer segment movement over time